V-Eye
I led the design strategy for a real-time vehicle safety network, translating federated learning and confidential computing into intuitive dashboards and a visual story that demonstrated collision prevention without privacy violation.

Role: UX Lead & UX Strategist
Client: MobilityXlab Gothenburg
Timeline: 1.5-day hackathon · November 2025
Team: Data Scientist, DevOps Engineer, Senior Innovation Strategist, 2 Software Engineering Students
Prototype: https://preview--streetview-aware.lovable.app/
Summary
I led the UX design and strategy for V-Eye, a federated safety concept developed during a 1.5-day MobilityXlab hackathon.
The challenge was to turn a complex technical brief around federated safety, confidential computing, and shared mobility data into a product experience that was understandable, credible, and compelling for both technical and non-technical stakeholders.
I designed the core user experience, dashboard interfaces, visual system, and animated product story — helping the team communicate how vehicles, cities, and infrastructure could collaborate to prevent collisions without exposing raw personal or sensor data.
My Role
UX Lead
Defined the UX direction and product structure under tight time constraints
Designed the driver-facing dashboard and operator/city dashboard
Created warning states, map overlays, risk indicators, and data visualization patterns
Built a consistent visual system with icons, alerts, state transitions, and motion principles
Made complex safety and data flows understandable through interface design
UX Strategist
Translated the technical brief into a clear product story
Structured the final pitch around problem, solution, system logic, privacy, business value, and societal impact
Designed a 10-scene animated Lovable prototype to explain the end-to-end concept
Turned abstract technical infrastructure into a tangible product experience
Balanced technical credibility with emotional clarity and stakeholder relevance
Cross-Functional Lead
Facilitated fast alignment between data science, engineering, innovation strategy, and design
Worked with technical teammates to understand federated learning, confidential computing, and edge processing
Helped prioritize what to prototype, what to visualize, and what to explain in the pitch
Connected user needs, technical feasibility, business viability, and presentation strategy

Challenge
Vehicles still miss cyclists, pedestrians, and other risks hidden behind buses, vans, corners, or urban structures. At the same time, cities and mobility actors collect valuable safety data, but privacy regulations and fragmented systems make real-time sharing difficult.
The design challenge was to show how a federated safety system could help vehicles and cities share insights without exposing raw data.
The strategic challenge was to explain a highly technical concept in a way that felt clear, actionable, and commercially viable within only 1.5 days.

Approach
I translated a complex federated safety concept into three clear design outputs:
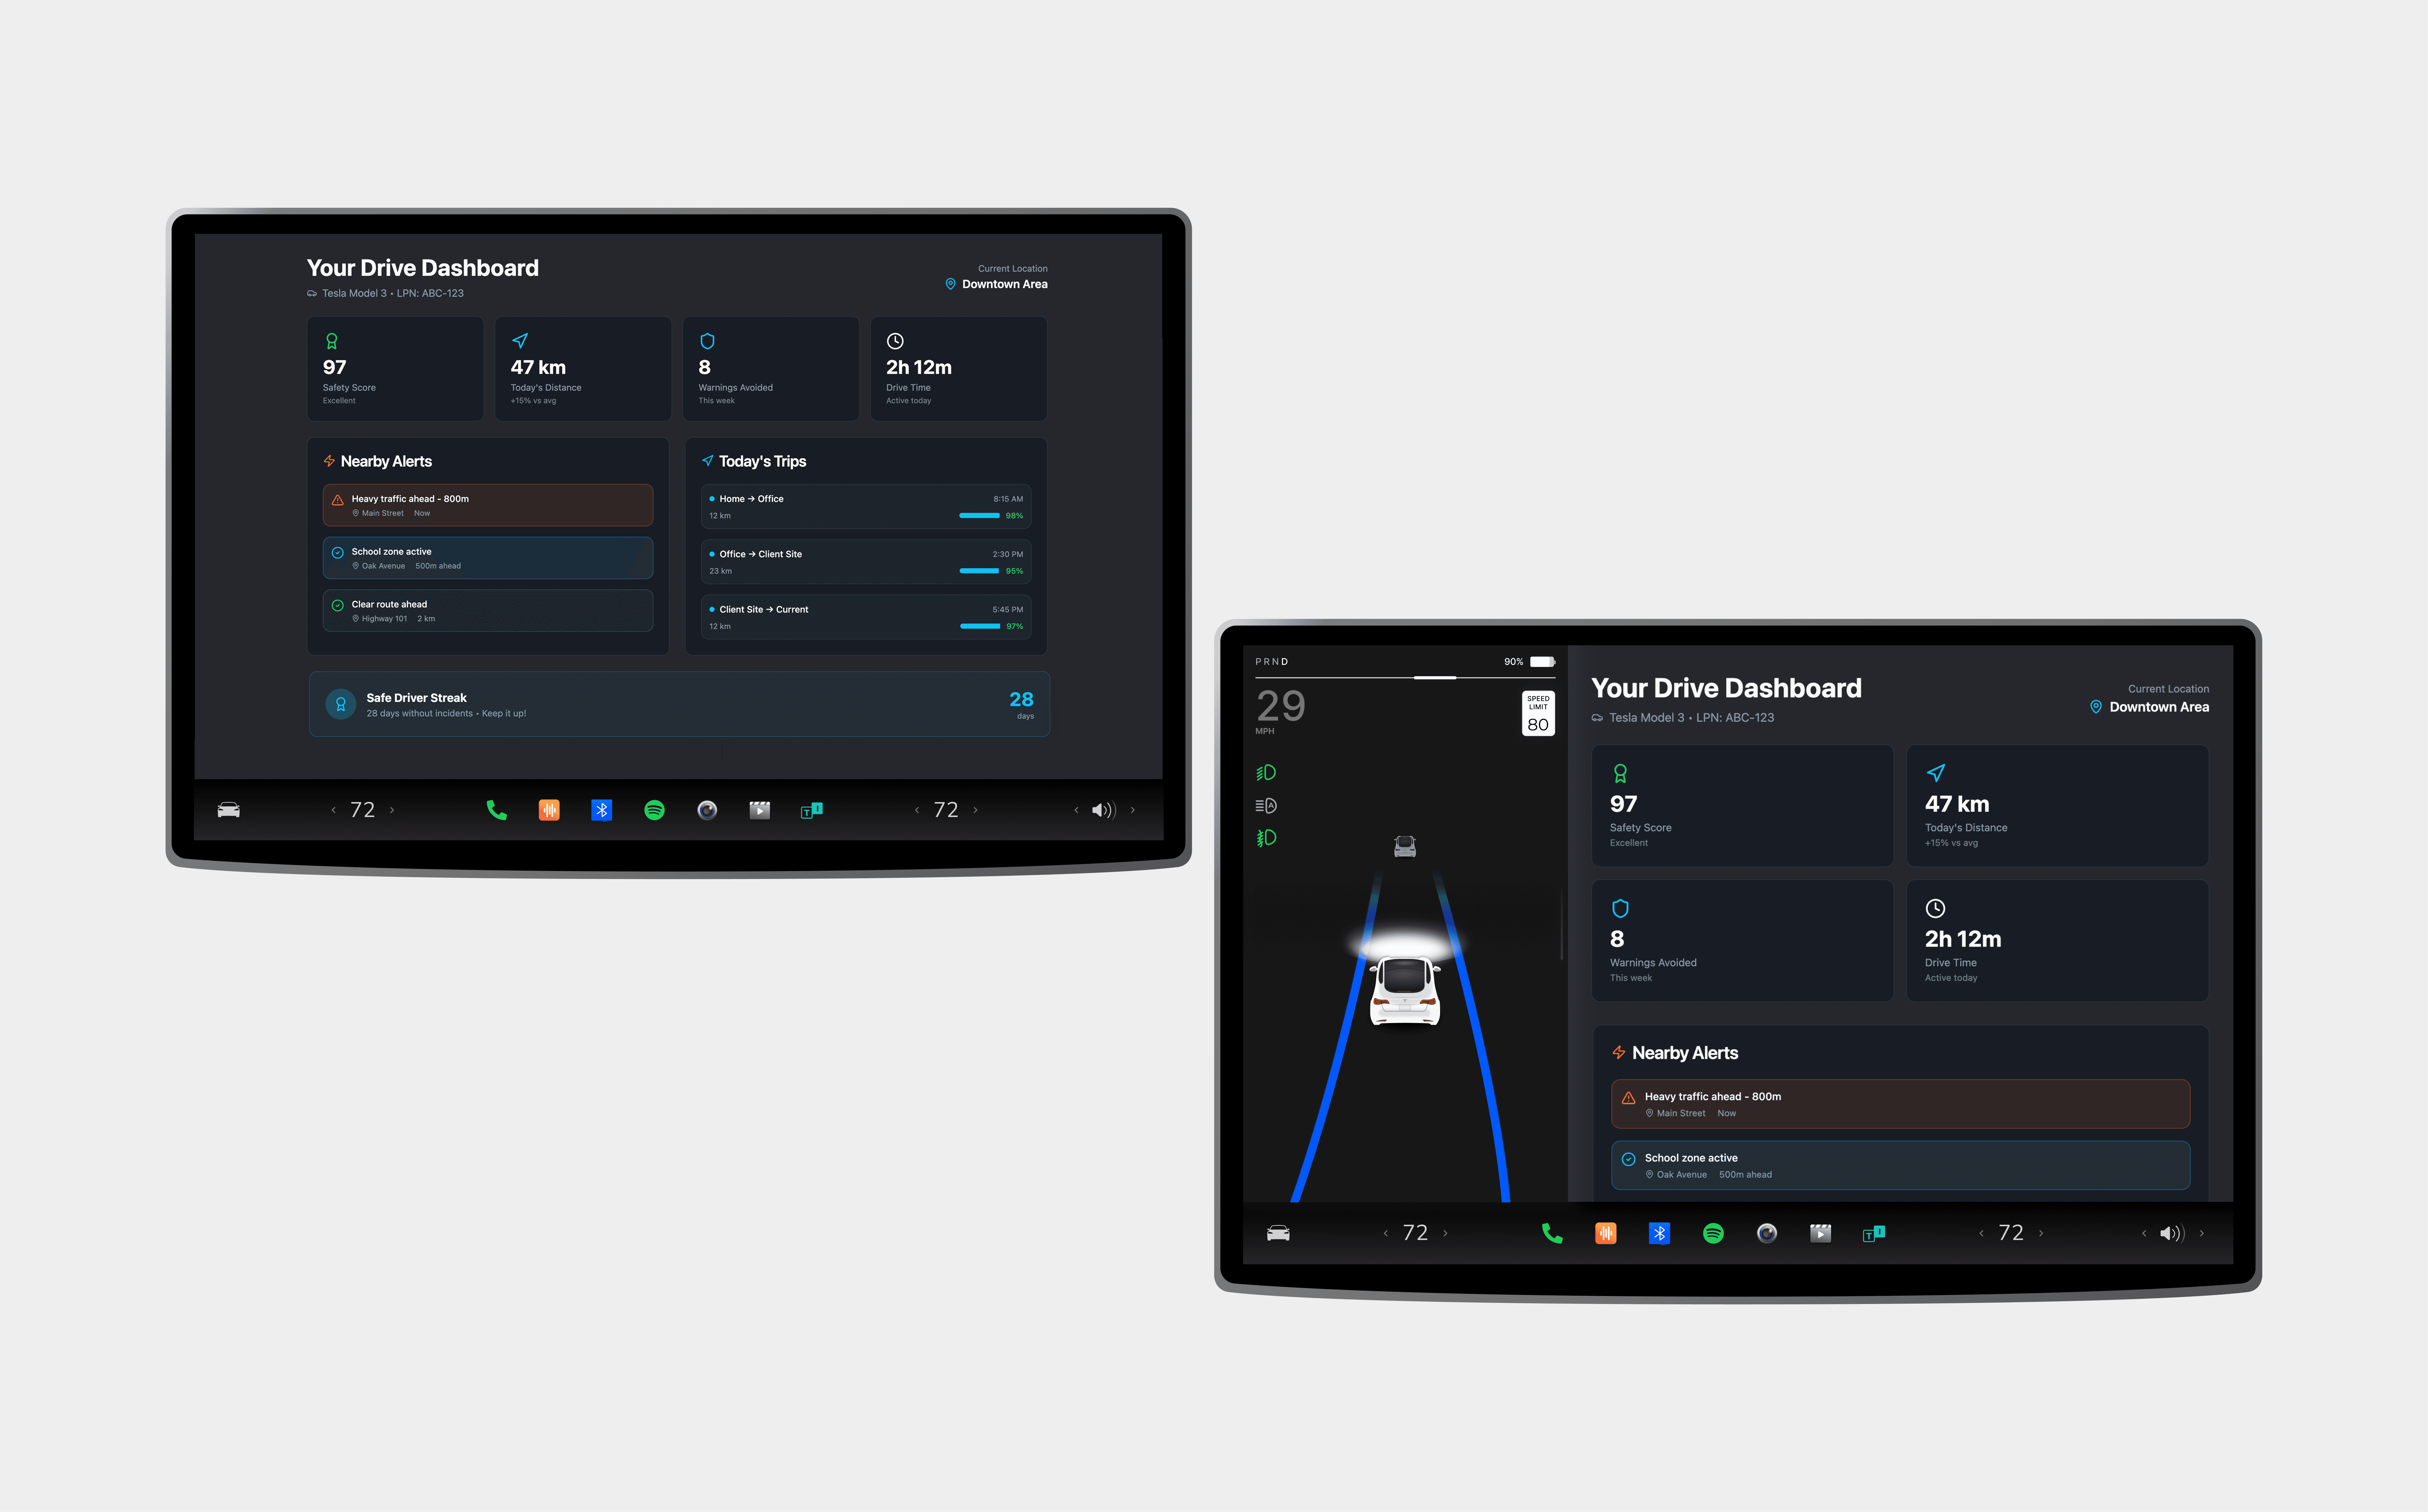
Driver dashboard
A glanceable in-vehicle interface showing blind spot alerts, nearby hazards, risk scoring, and what the car could “see” beyond its own sensors.
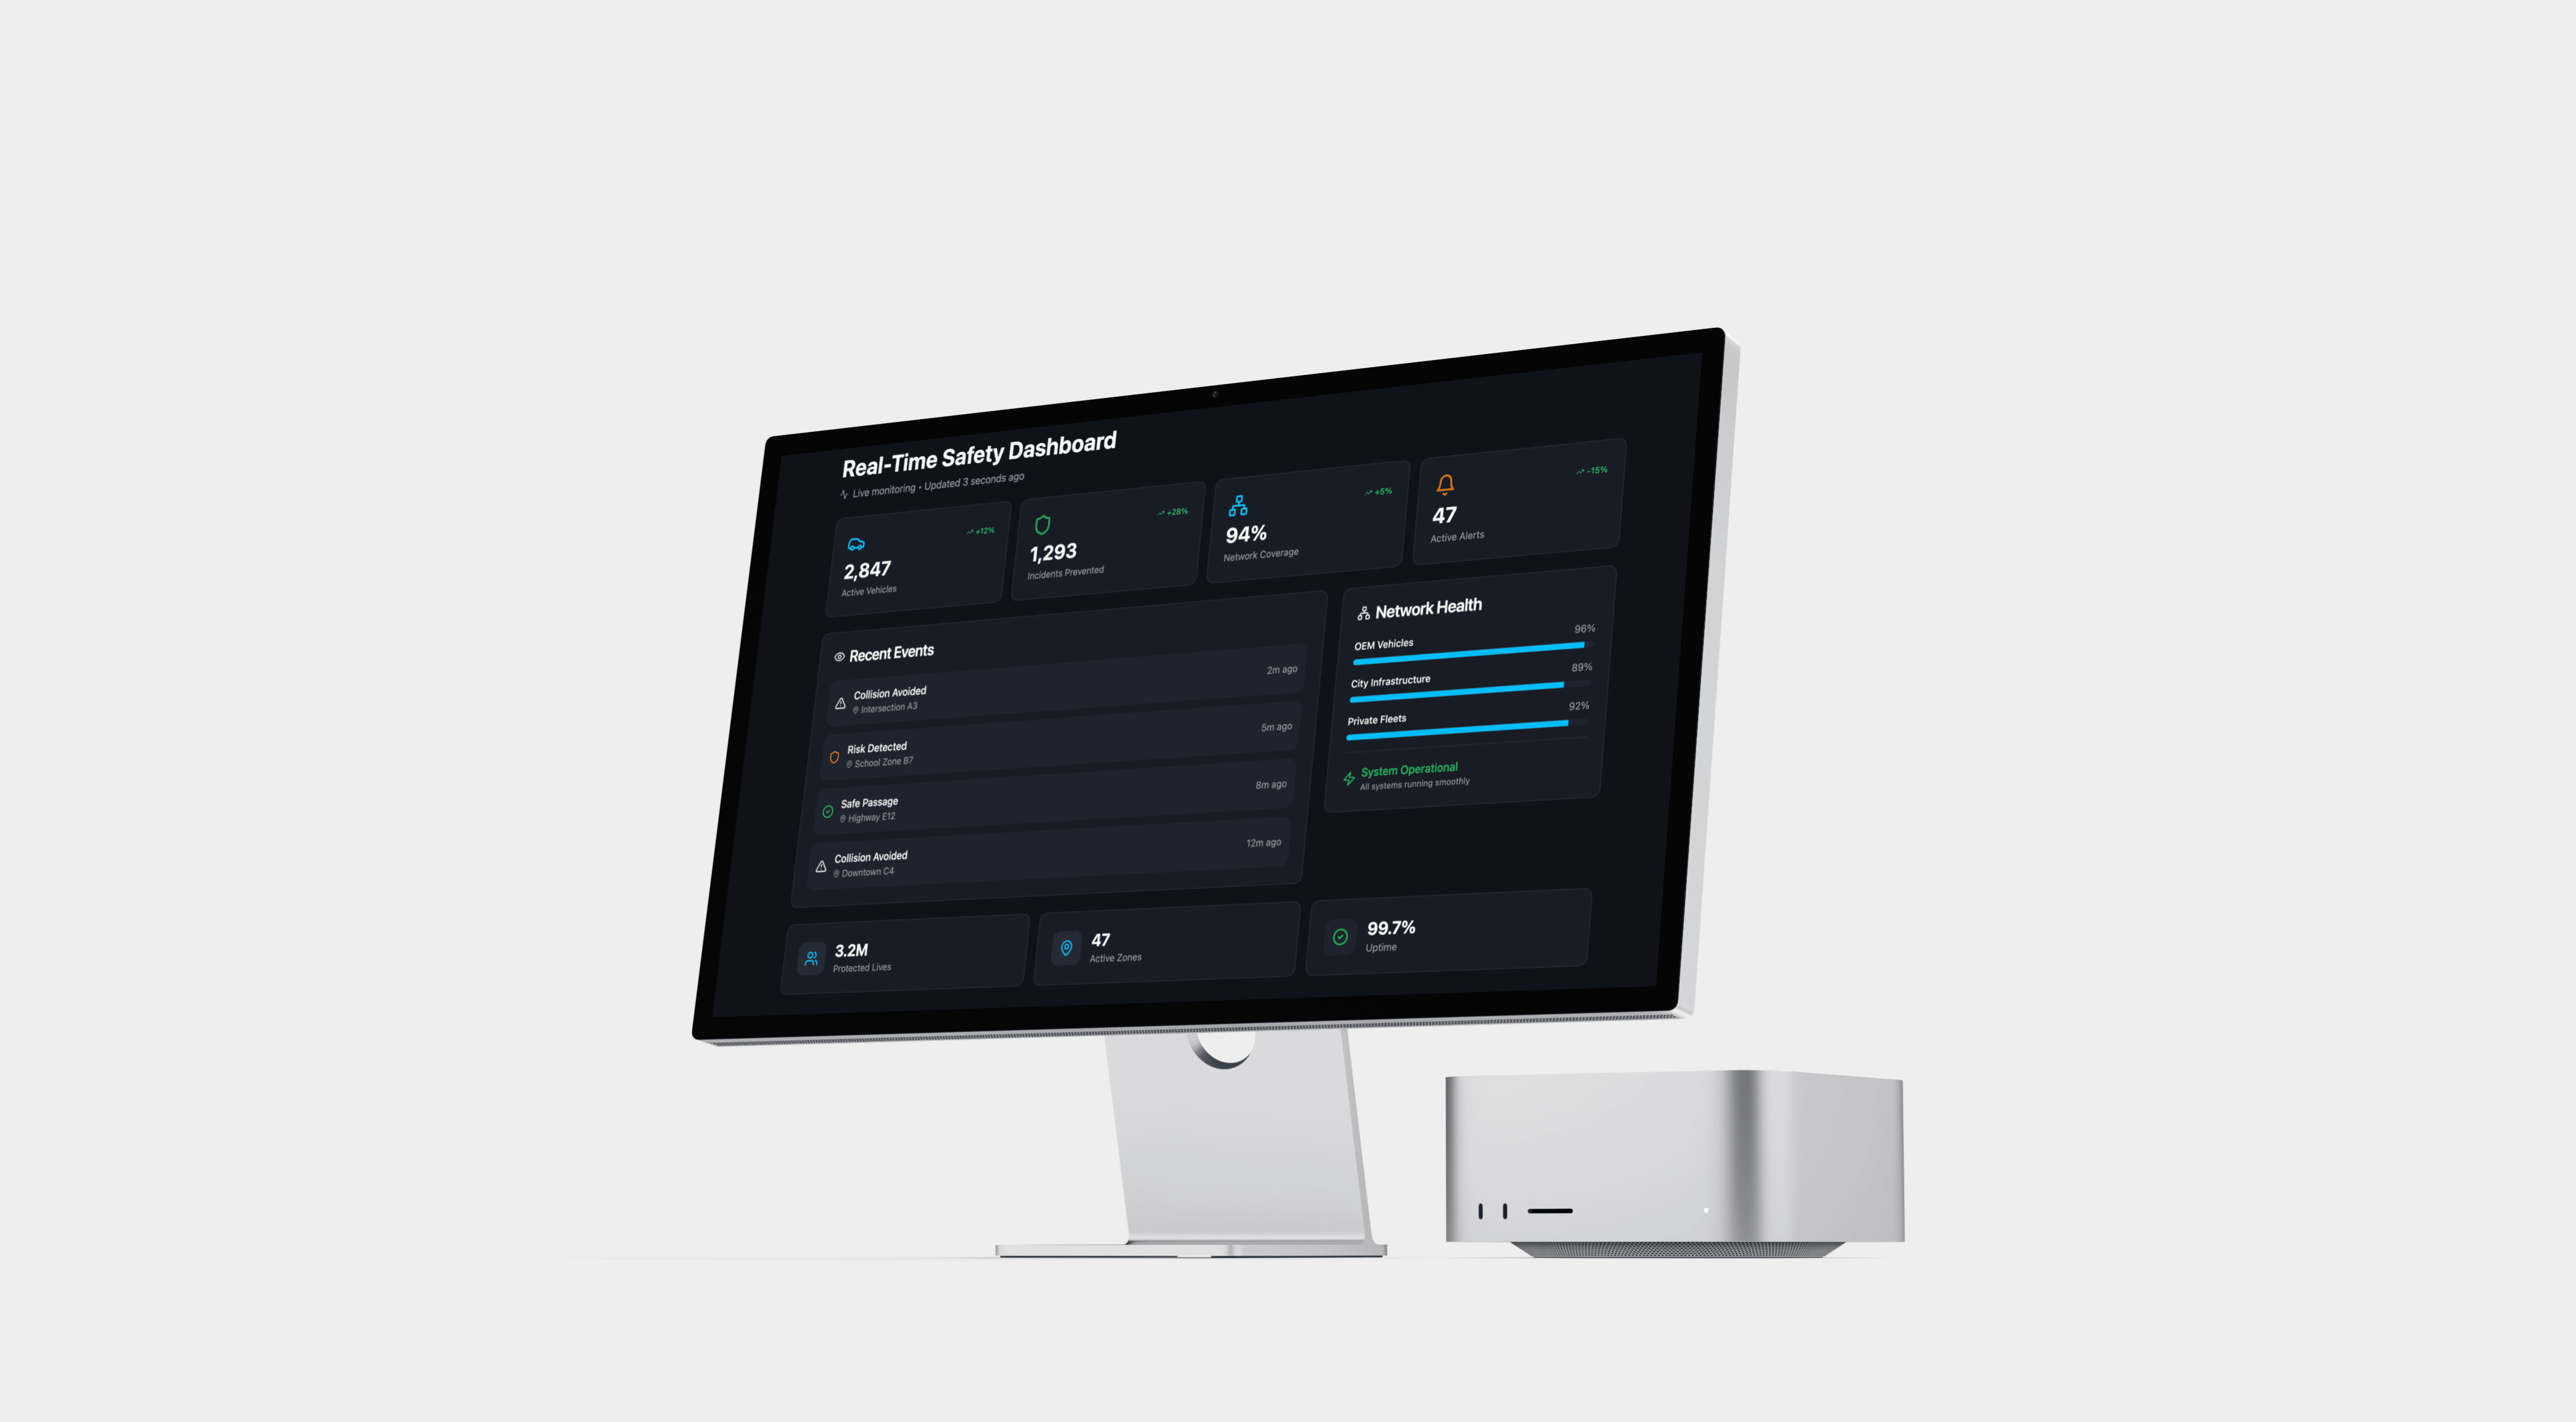
Operator dashboard
A city/fleet view showing collision hotspots, near-miss patterns, multi-camera fusion, anonymized data flow, and system status.
Animated product narrative
A 10-scene Lovable prototype explaining the problem, privacy-preserving system logic, real-time prediction, stakeholder value, and commercial potential.
Before designing, I helped the team align on users, value proposition, technical constraints, and pitch strategy so we could make fast decisions under the 1.5-day timeline.
Key Work
UX/UI Design
Driver dashboard · Operator dashboard · Warning states · Map overlays · Risk indicators · Interaction flows
Data Visualization
Collision hotspots · Multi-camera fusion · Data pipeline · Risk scoring · Near-miss tracking
Product Strategy
Concept framing · Value proposition · Business model logic · Stakeholder alignment · Pitch structure
Technical Translation
Federated learning · Confidential computing · Edge processing · GDPR-safe data flow · Anonymization
Rapid Prototyping
Lovable prototype · Animated story · Interface design · Motion states · Presentation-ready demo
Results
Delivered a complete presentation-ready safety concept in 1.5 days
Designed both driver-facing and operator-facing dashboard experiences
Created an animated product narrative that made federated computing understandable
Helped the team communicate technical credibility, societal value, and business potential
Translated a complex mobility infrastructure concept into a tangible product experience
Enabled engineers to focus on technical feasibility while I led UX, storytelling, and design execution


Core Skills Demonstrated
Product Strategy · UX/UI Leadership · Dashboard Design · Data Visualization · Rapid Prototyping · Technical Translation · System Mapping · Interaction Design · Motion Design · Stakeholder Communication · Pitch Strategy · Cross-Functional Collaboration · Lovable · AI-Assisted Prototyping
Takeaway
This project shows how I use design to make complex technology understandable, testable, and persuasive.
In 1.5 days, I turned a technical federated safety concept into a clear product story, two functional dashboard directions, and a pitch-ready prototype that connected user needs, technical architecture, privacy, business value, and societal impact.
Future potential: smart city infrastructure, autonomous vehicle fleets, fleet safety systems, and privacy-preserving mobility intelligence.